Project Based Learning: Engineering Edition
This blog post is from U-32 science teacher and PLP Pathways contributor Alison Gauthier.
On the Global Studies end, learners focused on various countries and policies in place to combat climate change. They learned about how the GDP of specific affected countries influences the policies people in the country are able to carry out. Learners also researched countries in the Global North versus the Global South and looked at the disparities in GDP between countries CAUSING the climate change and the countries BEING affected.
On the Earth Science end, learners engaged in scientific concepts around types of radiation received from the sun, the greenhouse effect, and the specific mechanism at play to increase the temperature of the planet.
After learning (and demonstrating understanding) about the general (and minor specific details) related to the greenhouse effect, learners were put in small groups of two or three persons. Each group was a country the learners had been exposed to during the Global Studies portion of the unit. Each country/group was awarded the GDP stated for that country. Each group had to research the specific climate change problems affecting their country, and brainstorm various solutions to each problem. Ultimately, each country chose one problem to focus on, and were charged with finding one feasible solution that they could model. T
he goal was that this model would show how that particular solution would lessen the effects of that problem. Each country had "their GDP" to use to buy materials to model their solution. Materials at the back of the room in the "supplies corner" each had an associated price. Costs of the materials were inflated to better represent the cost to make that sort of model on a larger scale. As examples, paper was $100 a sheet, a paperclip was $20, and glass beakers were $1,000 each.
Go to this site to learn more about the Earth Science unit plan and science concepts within the unit.
The solutions that learners came up with were of a great variety. Each solution had to be testable; that is, the solution had to produce a set of data. This set of data was analyzed and used by the countries to ultimately "show" that their solution produced favorable data. When countries tested a solution, they were able to determine if that specific solution did in fact produce data. If the solution wasn't data producing, or the data didn't support the expected or hoped hypothesis, the group revised the solution and re-attempted the trials to see if the revisions were favorable for the solution.
As a specific example, one country/group was assigned Bangladesh. Bangladesh's GDP is small so they sent representatives from the group to speak with USA and Germany to get outside funding. Once a donation amount was determined, it was approved by me if both parties were present and able to shake on the transfer of funds. Bangladesh's problem (as one of the results of climate change) was flooding. The solution the country chose was to make the "ideal home" to combat that problem. They designed a home on stilts that had certain unique features that would secure the stilts in to the ground and collect rain water into the home. They designed specific measurements for the home based on demographic information they collected about the people of Bangladesh. They added up the costs to make their model, and once they realized that the fundraiser enabled the construction, they built the home on stilts. They tested the home with two conditions; soil in the base and rocks in the base in order to determine the efficacy of their solution.
Here is an image of the "ideal home" for Bangladesh that they constructed to mitigate the effects of climate change that are specific to that country:
During the testing process:
Countries were given guidance as the process continued. In most groups, there was a natural delegation of responsibility based on each learner's abilities and interests.
In one group of three, for example, the group decided that one person was ultimately responsible for the design and construction, one person was responsible for the finances and data, and the third participant was responsible for pulling all items together into the presentation. In other groups, facilitation by the teacher was required to enable the ninth grade learners to each have a significant role in the project and outcomes.
Class-wide check-ins occurred at the beginning of class (75 minutes long), and then groups were free to work on their design, construction, testing and revisions as they pleased. Here is the engineering process diagram that the countries and I often referred to when discussing the progress of the solution and steps moving forward:
Each class, I would conference/check-in with groups individually. After approximately a month of group-led class time, each country presented to the class. The presentations themselves did not contribute to their overall proficiency scores for the unit (or weren't required I could say), but some students were actually able to demonstrate their proficiency on one or more of the scales through the presentation. Other learners demonstrated their proficiency to me DURING the actual group work and process. Other learners didn't yield evidence during the country process or during the presentation; those learners met with me or re-performed in a more traditional manner. Here is the cover sheet from this unit. The proficiency scales used to give learners feedback on their progress are within the cover sheet.
Following the presentations, learners received SUMMATIVE feedback on their learning up to that point in the unit. They were able to ask questions about the feedback and make plans to move forward. At that time as well, they added one or two products to their Personalized Learning Sites (PLSs) and reflected on their progress over the unit. They were allowed to choose any "products" to embed in the site. Some embedded images of their solution/design that they tested; others put a link to a Google sheet where they managed and analyzed all the data from their solution.
While learners worked on their sites, I met with students individually to conference about their learning during the unit and make steps moving forward for the students who needed to reperform. Prior to this unit, I would simply hand back summative feedback. When doing this, I would find that there was often confusion or questions that individuals would have for me. By discussing the feedback during a conference, learners felt more comfortable to ask questions and make an action plan moving forward (either for reperformance within that unit or goals for the next time they worked in a group or with a similar set of skills).
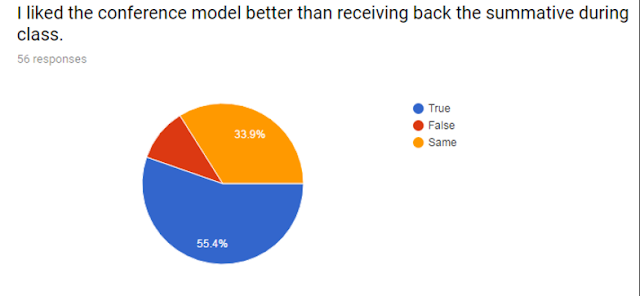
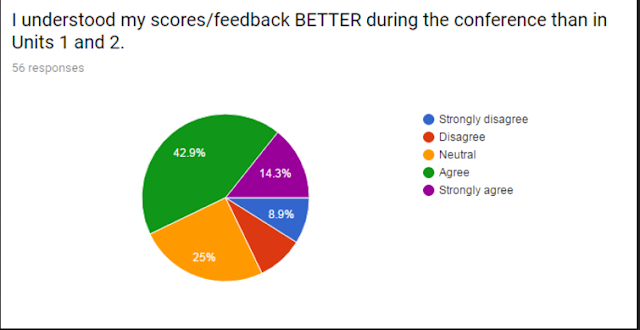
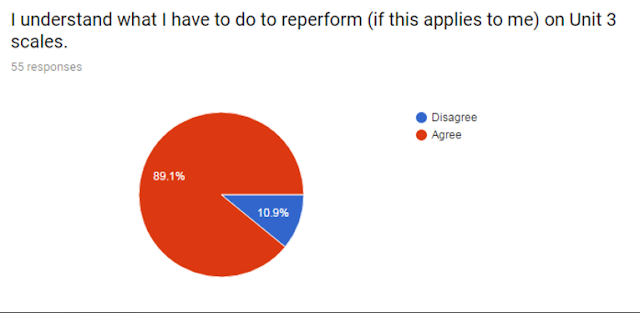
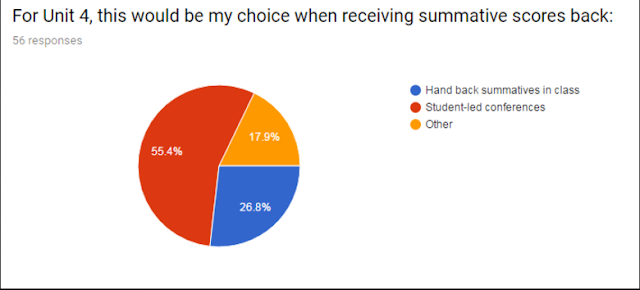
I was curious if the conferences was a more meaningful way to receive feedback, so I polled my three ninth-grade sections of Earth Science. These are the quantitative results from the polls. After each quantitative-yielding question, a qualitative question was asked.The qualitative information from the students included ideas going forward and why they preferred the student-led conferences or not.
Overall, the feedback was in favor of student-led conferences as the way to receive summative feedback following a unit. The conversations during the conferences were rich; in fact, some learners were able to quickly demonstrate that they knew something during the conference that hadn't been expressed during the group presentation or group work.


